Inspect a Session Timeline
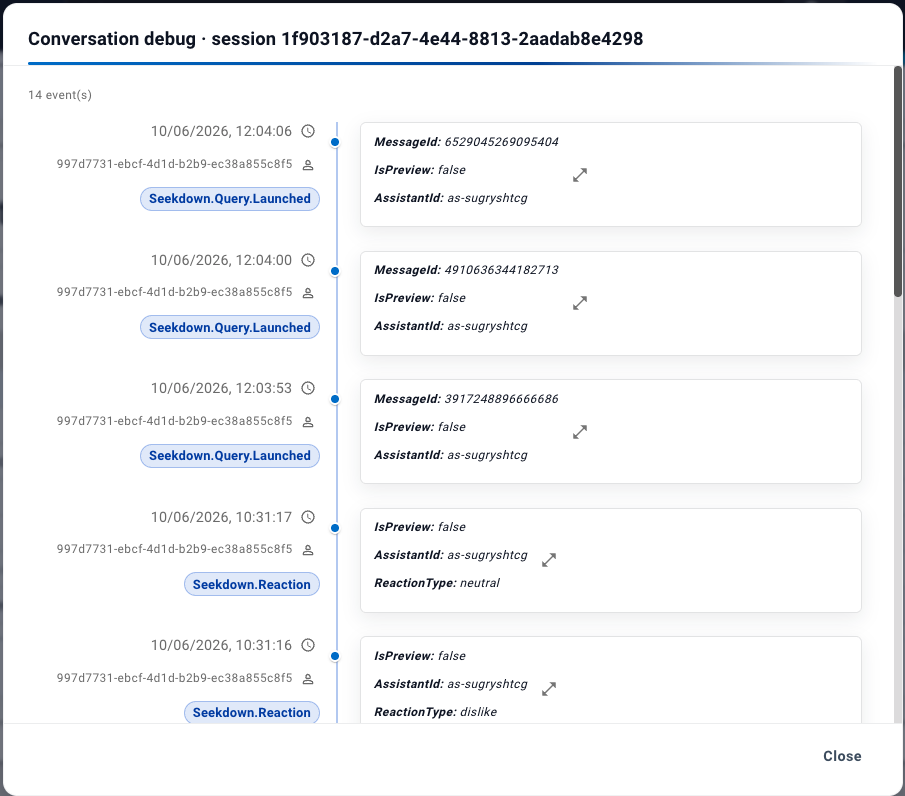
The session timeline is a technical view that shows every event that happened during a visitor's session, in chronological order. It's useful for debugging unexpected behavior or for providing session details to support.
Steps
- Open the Conversations table (from global or assistant analytics).
- Find the conversation you want to inspect.
- Click the debug icon (the second action button on the row).
- A dialog opens showing the session's events in order.
What You See
The timeline shows raw events — the internal signals the assistant processed during the session. Each event has a type and a timestamp. Common events include:
- Session.Started — the visitor opened the assistant.
- Query.Launched — a question was submitted.
- Response.Received — the assistant answered.
- Reaction.Submitted — the visitor reacted to an answer.
- Form.Submitted — the visitor submitted a form.
When to Use It
- When a visitor reports a problem and you need to see exactly what happened.
- When the assistant gave an unexpected answer and you want to trace the sequence.
- When contacting support — share the session ID so the team can look up the
same timeline.