Analytics
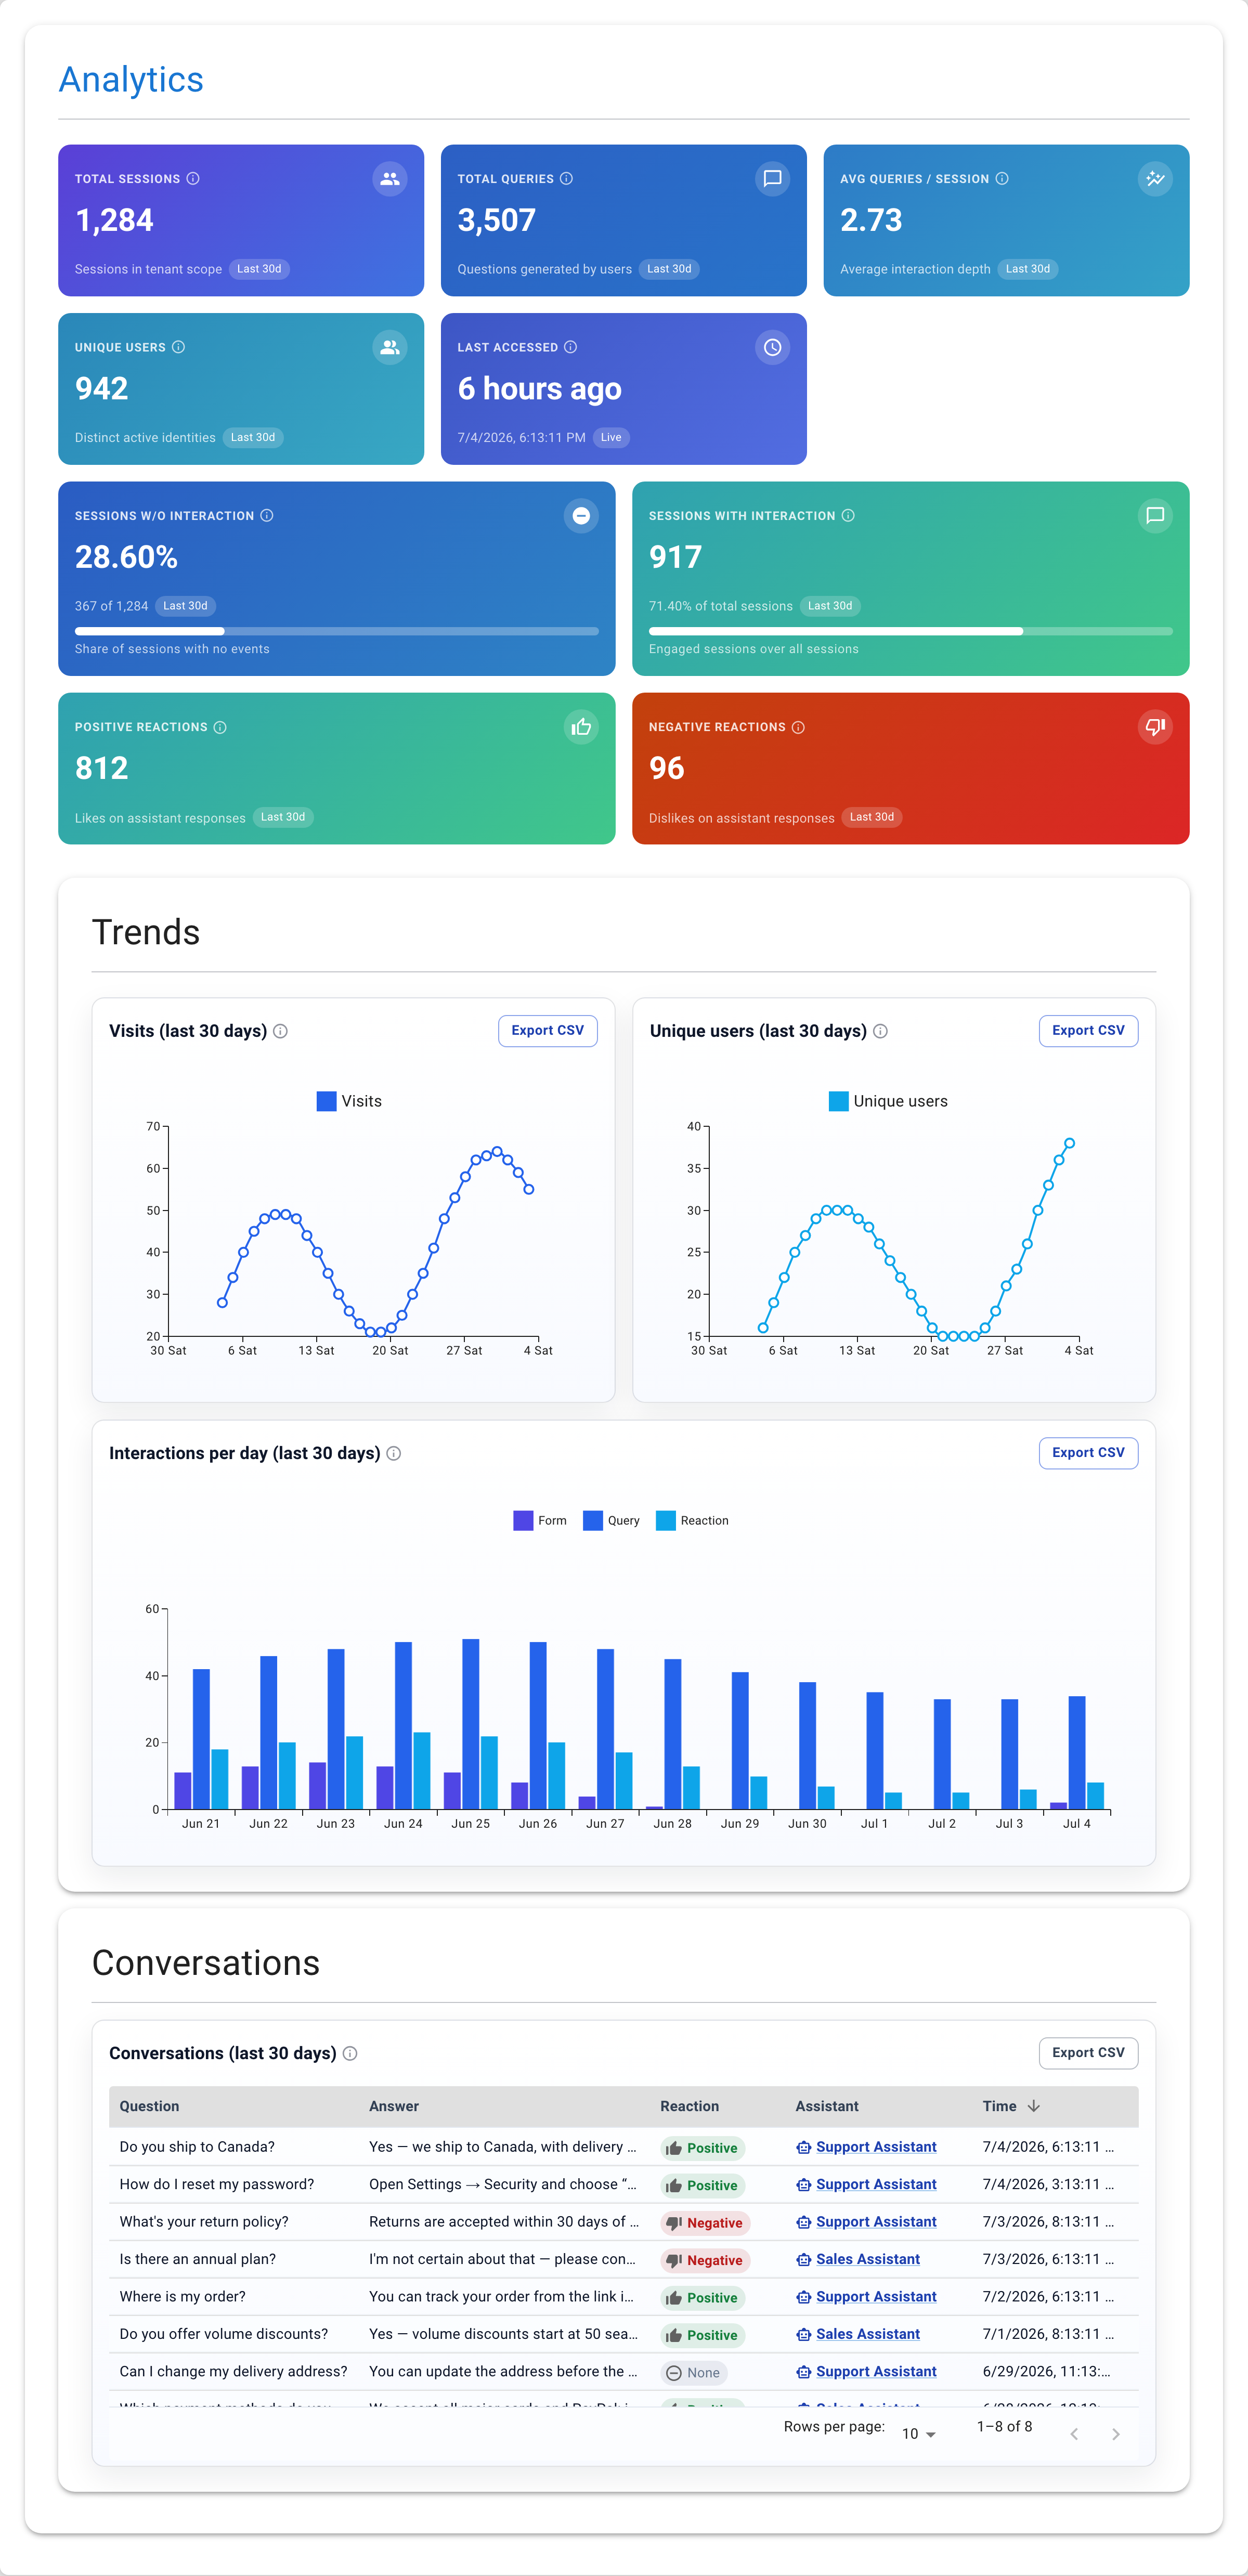
Once an assistant is live, analytics tell you how people actually use it — what they ask, how often, and whether the answers landed. It's the signal that closes the loop: you watch what's asked, then improve the dataset behind the answers.
What Analytics Track
A session groups one visitor's activity during a stretch of use, and every question and answer inside it is recorded. The vocabulary you'll meet:
- Visit — a session that started.
- Unique user — a distinct visitor identity stored in a browser.
- Query — a question asked to an assistant.
- Reaction — positive (like) or negative (dislike) feedback on an answer.
- Conversation — the full question-and-answer history for a session.
You can read analytics globally (across all your assistants) or per assistant, and open any single conversation to see exactly what was asked and how it was answered.
Review the Conversation History
Beyond the top-line numbers, analytics keep the full history of conversations, so you can go back and read the actual interactions your users had with an assistant — not just how many, but what they said. This is where you learn the why behind the metrics.
For any assistant you can:
- Browse past conversations and open one to read it end to end — every question the visitor asked and every answer the assistant gave, in order.
- Follow a session timeline, seeing how a single visit unfolded from the first question to the last.
- See the reactions a visitor left, so you can tell which answers landed and which frustrated them.
- Spot recurring questions and dead ends — the phrases people use, the things the assistant couldn't answer, the moments they gave up.
Reading real conversations is the fastest way to find gaps in your dataset and rough edges in the assistant's behavior: you see the exact wording people use, then add the content or the rule that would have answered them.
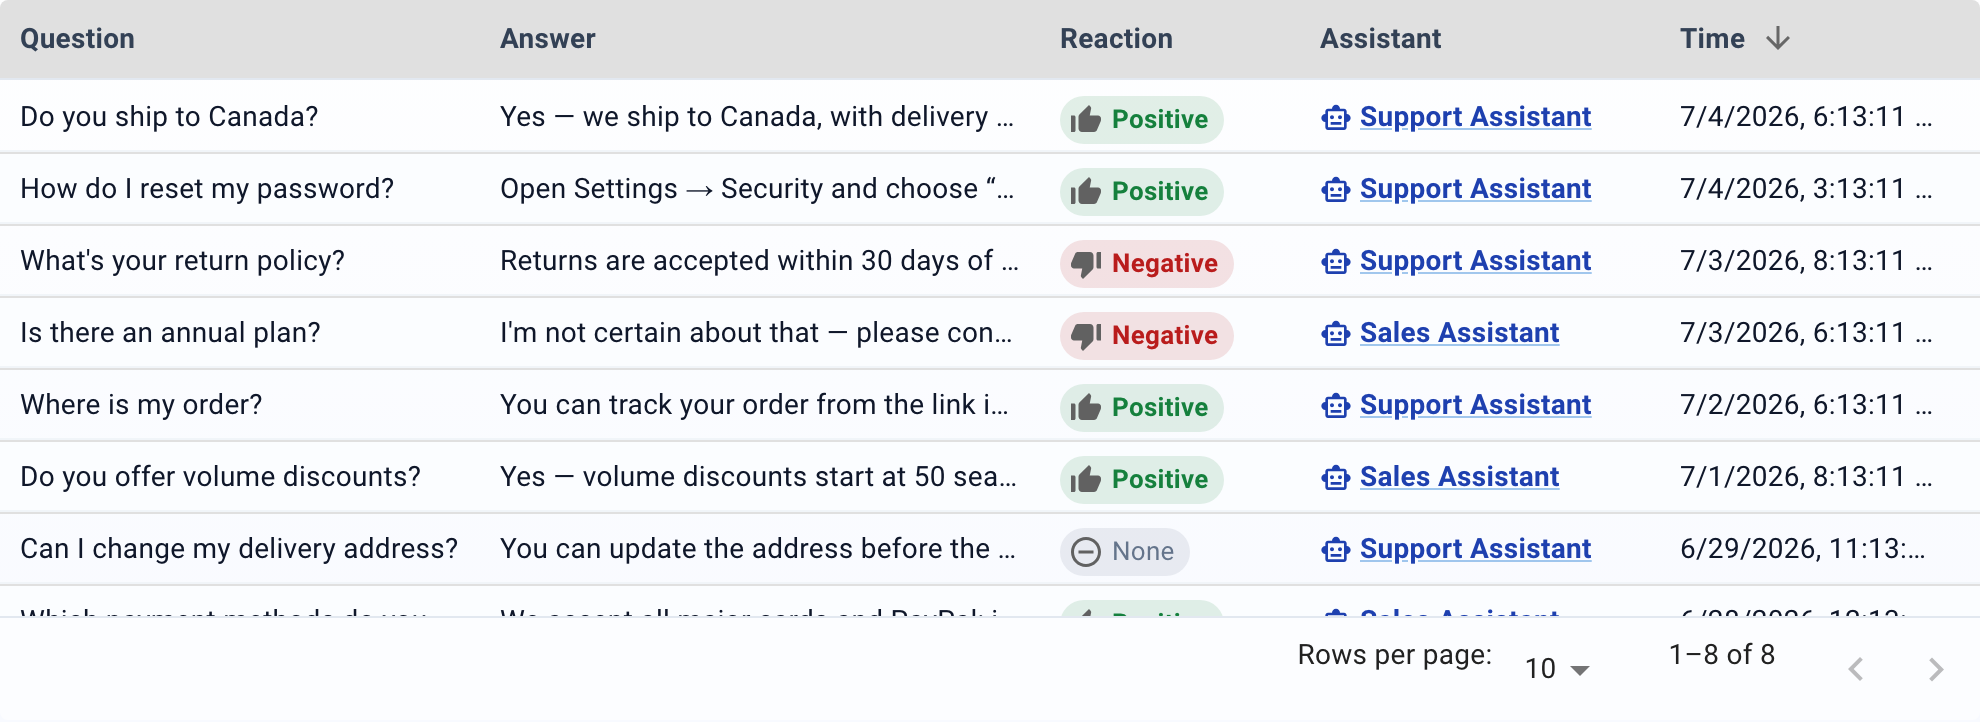
For example, a team spots in analytics that "return policy" is asked dozens of times a week and collects a lot of dislikes. They add a clear returns page to the dataset; within days the same question starts getting liked answers — and the dashboard shows it.
What the numbers cover
Analytics summarize the last 30 days and exclude traffic from the dashboard preview. Each answer also records the tokens it used, which feed the usage shown on your account. The same person in two browsers counts as two unique users.