Read Usage
The usage overview shows how much of your plan's resources you have consumed in the last 30 days. Use it to understand where your quota goes and whether you need to upgrade.
Metric Cards
Four cards at the top summarize your consumption:
| Metric | What it measures | Unit |
|---|---|---|
| Tokens | LLM input and output tokens used when assistants answer questions. | tokens |
| Content storage | Indexed content stored across all datasets. | bytes (KB / MB / GB) |
| Proxy traffic | Datacenter proxy bandwidth used by data capture jobs. | bytes |
| Residential proxy | Residential proxy bandwidth used when a site requires a residential IP. | bytes |
Each card shows the amount consumed, the plan limit, a percentage chip, and a progress bar. The bar turns yellow at 70 % and red at 90 % so you can spot limits before you hit them.

Usage Breakdown
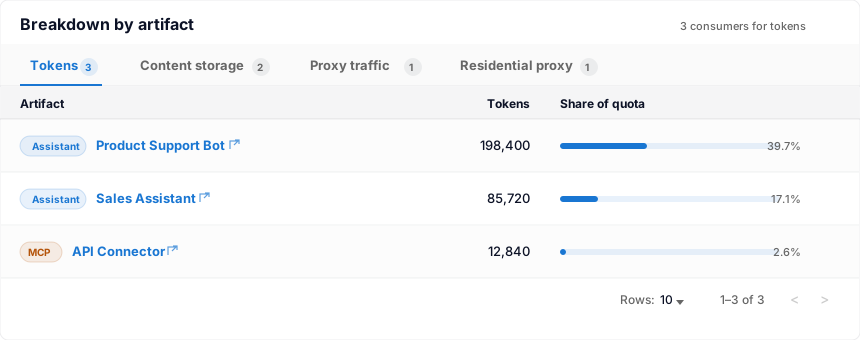
Below the cards, a table breaks down consumption by artifact — the specific dataset, assistant, data capture job, or MCP server that used the resources. Each row shows:
- The artifact name (clickable link to its detail page in the dashboard).
- Its type (Dataset, Assistant, Data Capture Job, or MCP).
- The tokens, storage, proxy, and residential proxy it consumed.
Use the breakdown to identify which artifact is driving usage — for example, a single assistant that consumes most of your tokens, or a data capture job that uses a large share of proxy bandwidth.
Steps
- Open My Account from the sidebar.
- Find the Last 30 days usage section.
- Review the metric cards for a quick summary.
- Scroll to the breakdown table for per-artifact detail.
Tips
- New accounts may show no data until the first assistant answers a question or
the first data capture job runs.
- If usage looks unexpectedly high, check the breakdown — a misconfigured
data capture job or a very busy assistant is usually the cause.
- Usage resets on a rolling 30-day window, not on your billing date.