Read Global Analytics
Global analytics give you the big picture — usage across every assistant and search center in your workspace, in one place. Open Analytics from the main sidebar to see it. A View analytics for selector in the page header lets you switch from this tenant-wide view to any single assistant or search center at any time (see Switch Between Views).
KPI Cards
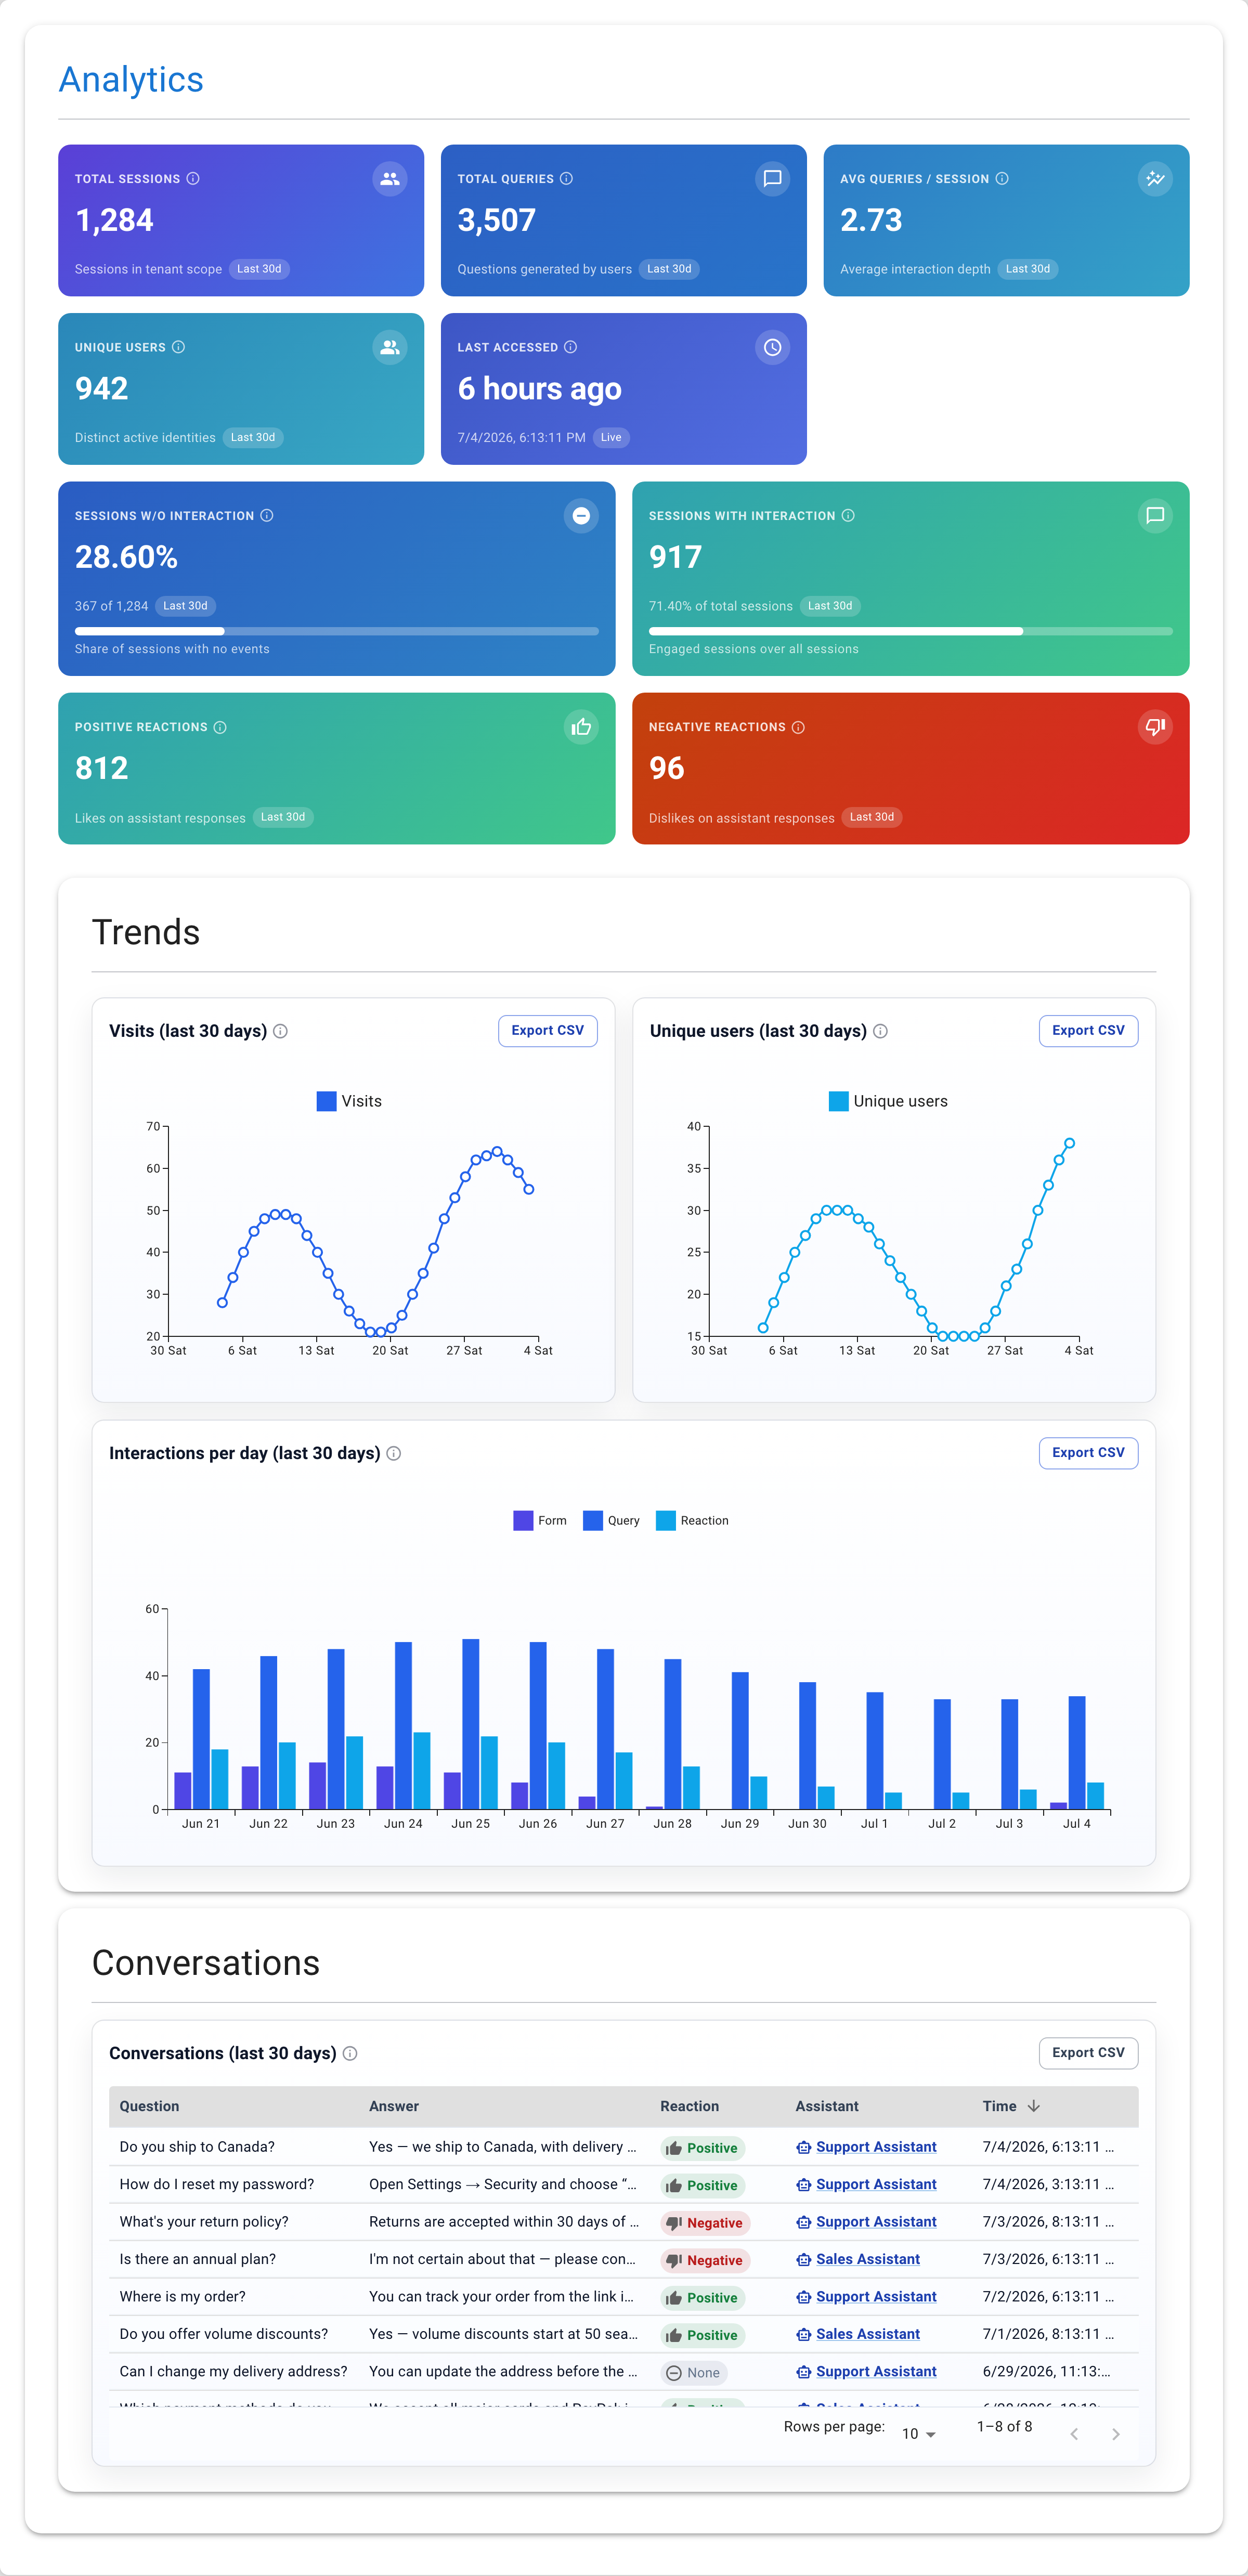
The top of the page shows nine cards summarizing the last 30 days:
| Card | What it shows |
|---|---|
| Total Sessions | How many sessions started across all assistants. |
| Total Queries | How many questions visitors asked. |
| Avg Queries / Session | The average number of questions per session — a measure of how deep conversations go. |
| Unique Users | How many distinct visitors used an assistant. |
| Last Accessed | How long ago the most recent interaction happened — useful to confirm traffic is flowing. |
| Sessions w/o Interaction | The share of sessions where the visitor opened the assistant but didn't ask anything. A high number may mean the welcome message or hints need work. |
| Sessions with Interaction | How many sessions had at least one query, reaction, or form submission — your engaged audience. |
| Positive Reactions | Total thumbs-up reactions on answers. |
| Negative Reactions | Total thumbs-down reactions — the best signal for answers that need improvement. |
Trends
Below the KPI cards, three charts show how usage evolves over the last 30 days:
- Visits (last 30 days) — a line chart of daily sessions. Look for trends
(steady growth, weekday/weekend patterns) and spikes (a launch, a campaign, a social media mention).
- Unique users (last 30 days) — a line chart of daily unique visitors.
Compare it with visits to see how many visitors return.
- Interactions per day (last 30 days) — a stacked bar chart breaking down
daily activity by type: queries, form submissions, and reactions. This is the clearest view of what visitors actually do.
Each chart has an Export CSV button to download its data.
Conversations
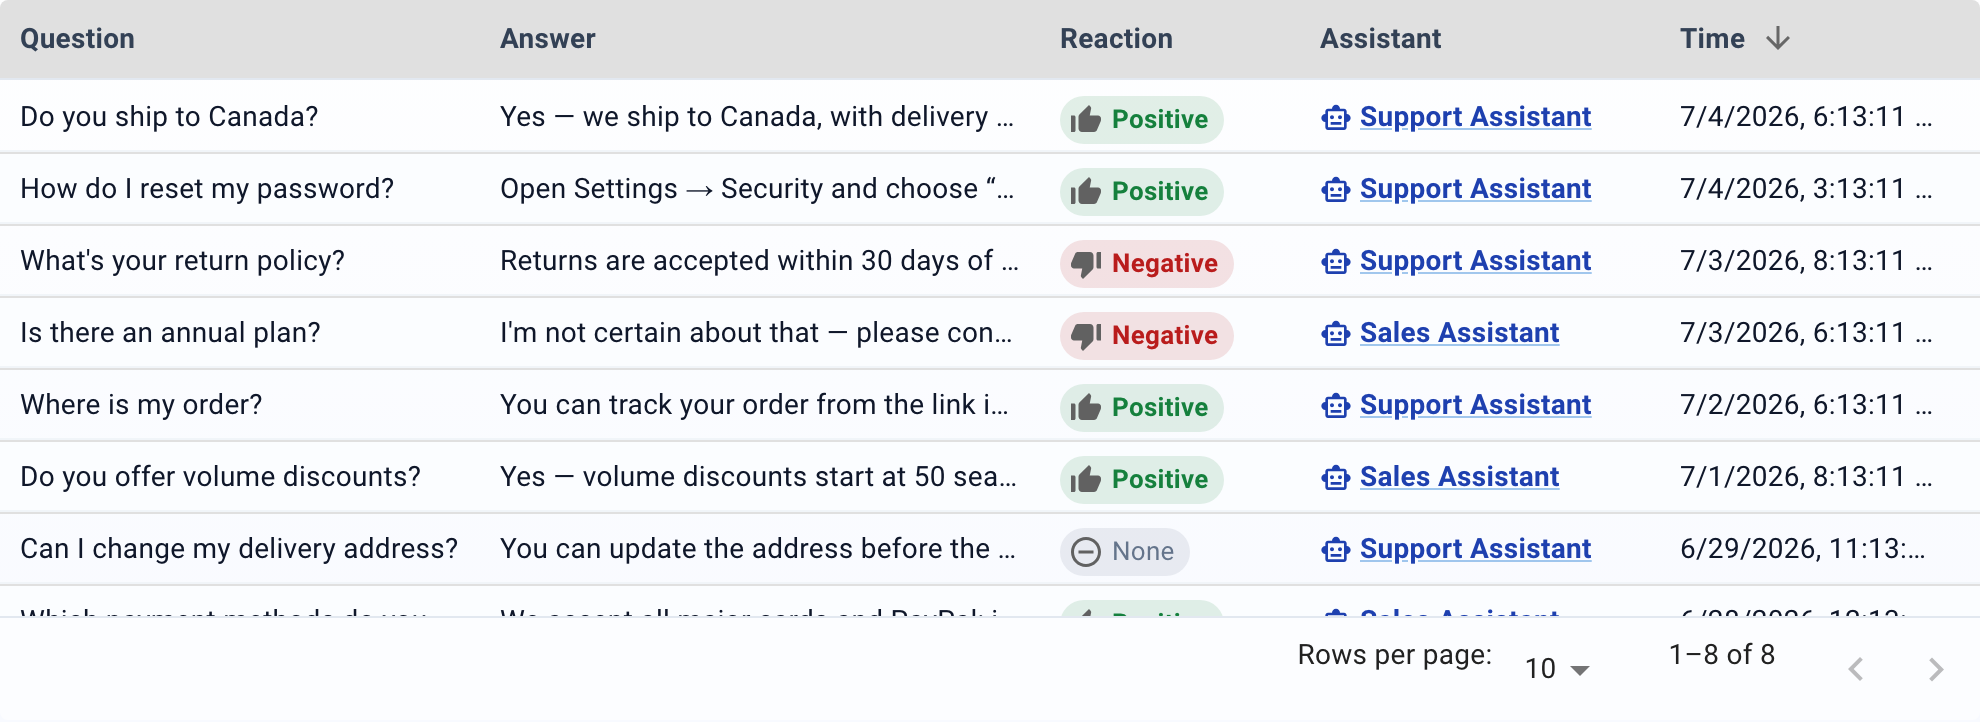
At the bottom, the Conversations table lists every question and answer from the last 30 days, across all assistants. Each row shows:
- Question — what the visitor asked.
- Answer — what the assistant replied (truncated — click to see the full text).
- Reaction — Positive, Negative, or None.
- Assistant — which assistant handled the question (clickable link to its detail page).
- Time — when it happened.
Use Export CSV to download the full table.
What to Look For
- High "Sessions w/o Interaction" — visitors open the assistant but leave
without asking. Improve the welcome message, add better hints, or make the assistant more visible.
- Negative reactions on a specific question — the answer is wrong or
incomplete. Find the missing content in the dataset and add it.
- Dropping unique users — fewer people are using the assistant. Check
whether the embed is still live and whether the content is still relevant.
- Avg queries / session rising — visitors are going deeper, which usually
means the assistant is useful and worth exploring.